基于hadoop和echarts的教育大数据可视化系统 毕业论文+课题申请表+任务书+开题报告+外文翻译及原文+大纲+答辩PPT+成果使用说明书+项目源码及数据库文件

基于hadoop和echarts的教育大数据可视化系统
摘 要
在线教育平台现在是教育体系的重要组成部分,在当前大数据时代的背景下,促进教育机构建立统一平台、统一资源管理的数字化教学系统。如何评估系统平台的健康程度、学生的学习体验和在线课程的质量对于课程的教师和学校的管理人员都是非常重要的,这是进行数据分析的主要目的。可视化是一个重要的途径,它能够帮助大数据获得完整的数据图表并挖掘数据的价值,大数据分析离不开可视化这一工具的推动。
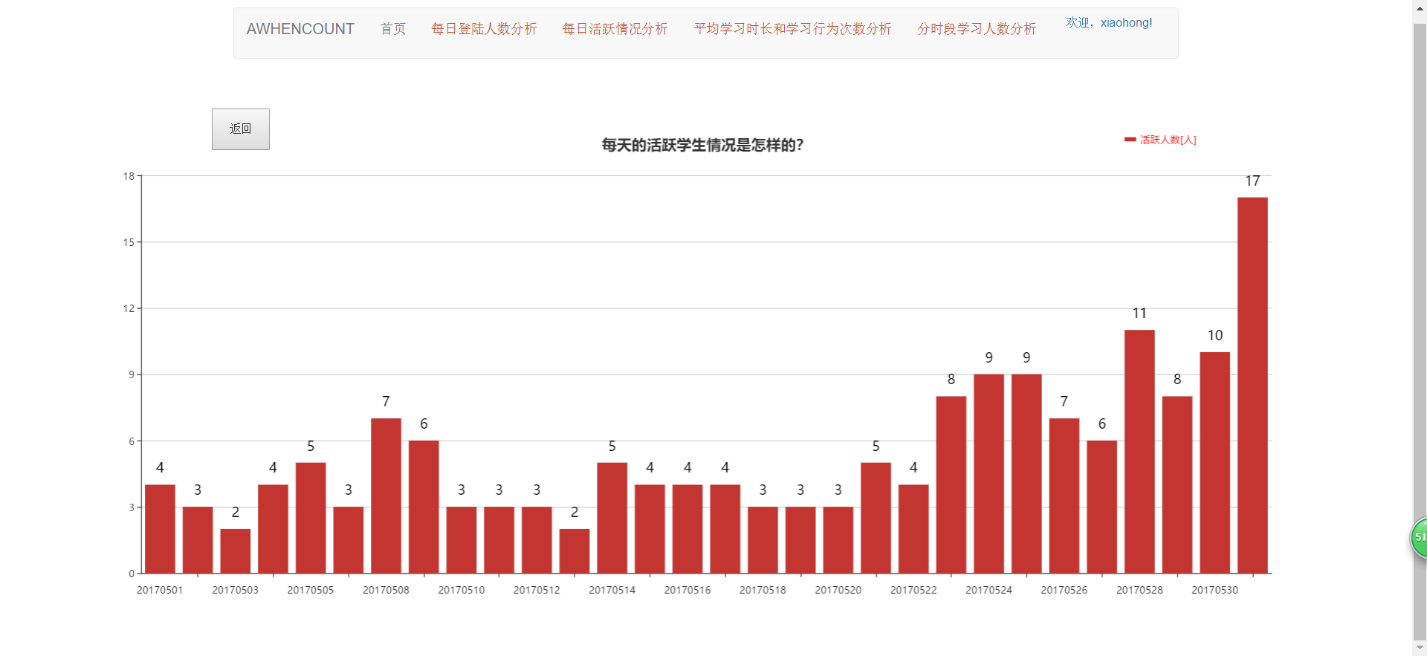
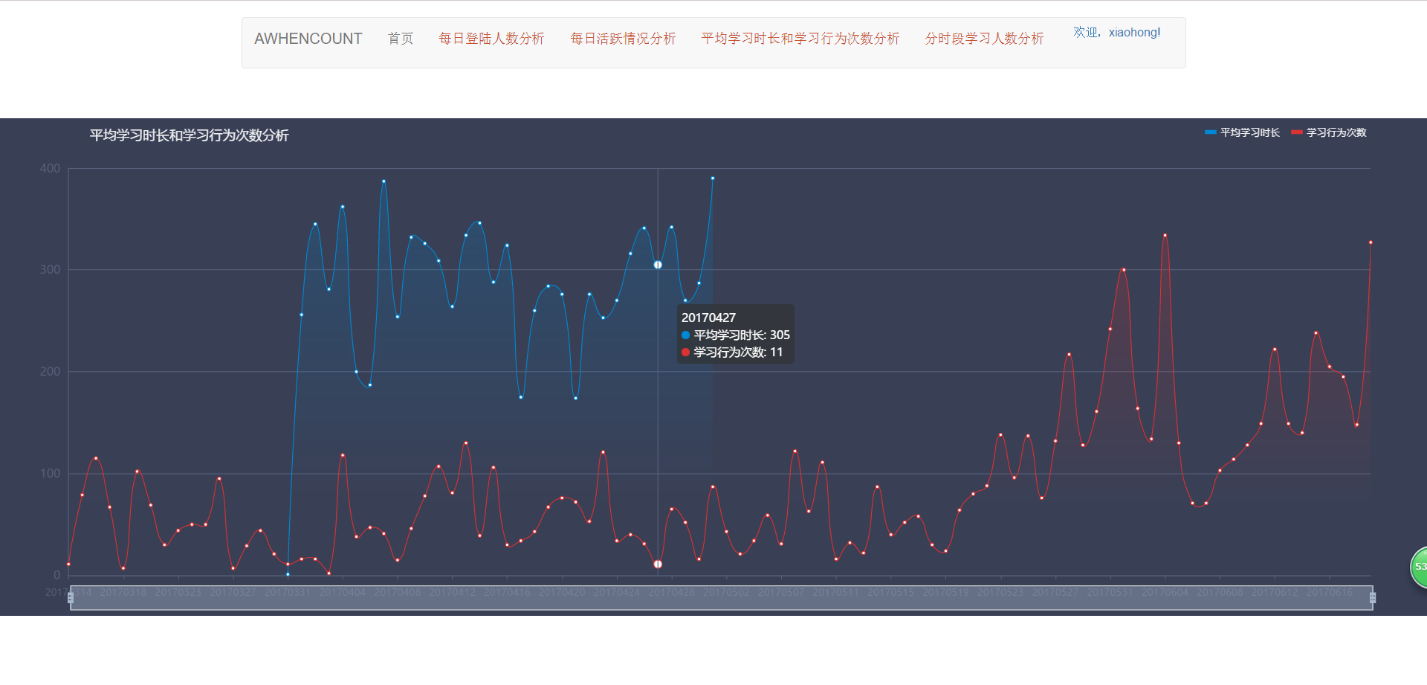
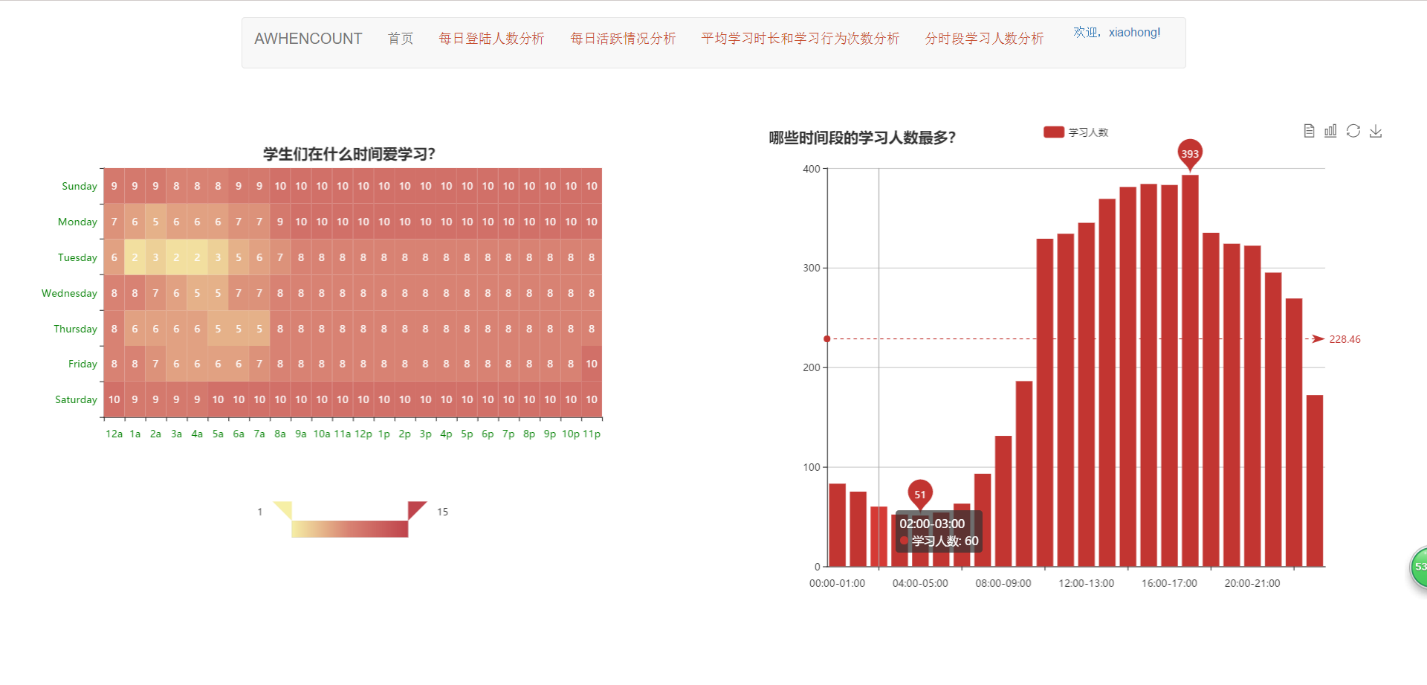
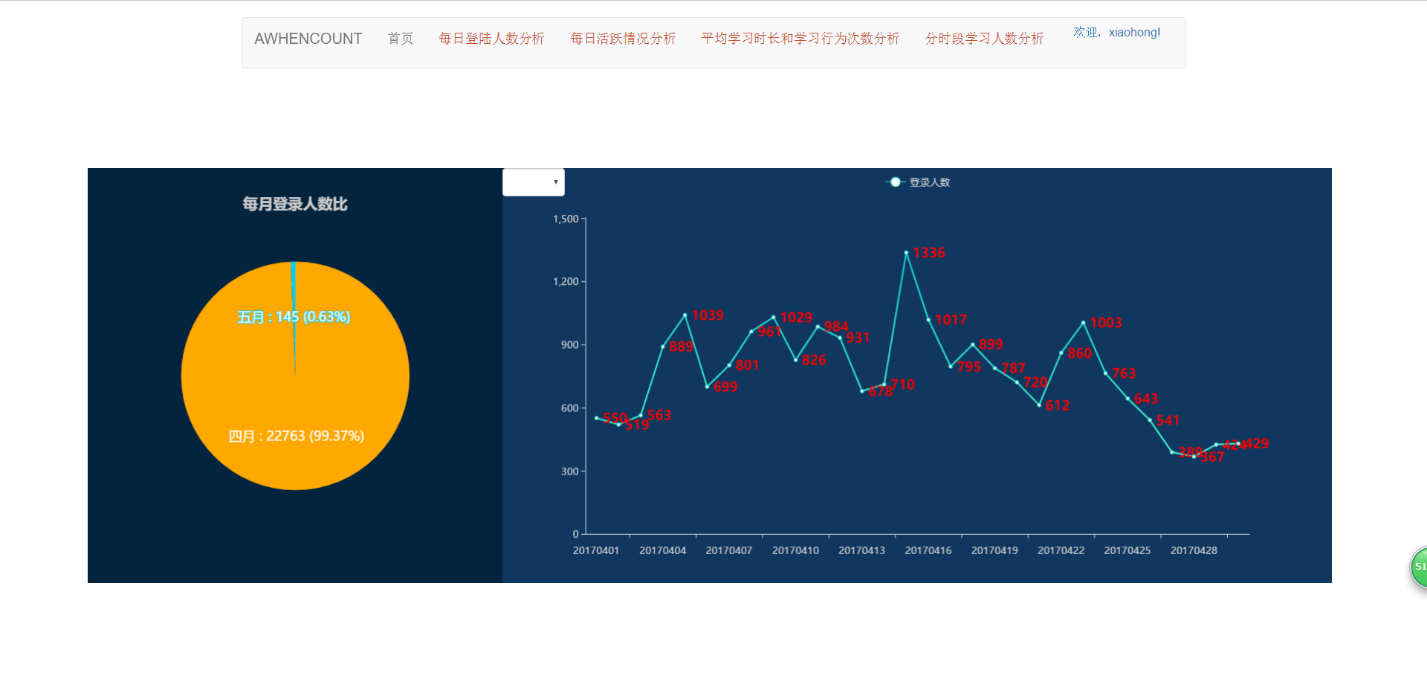
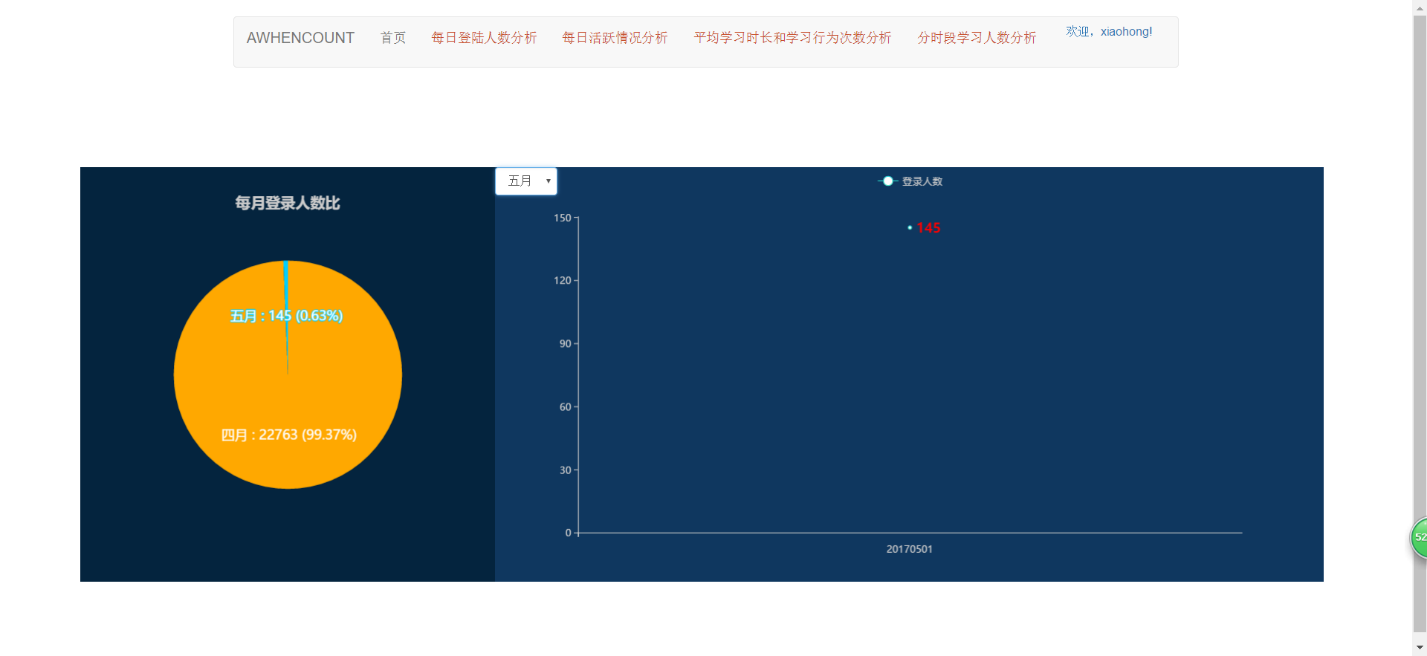
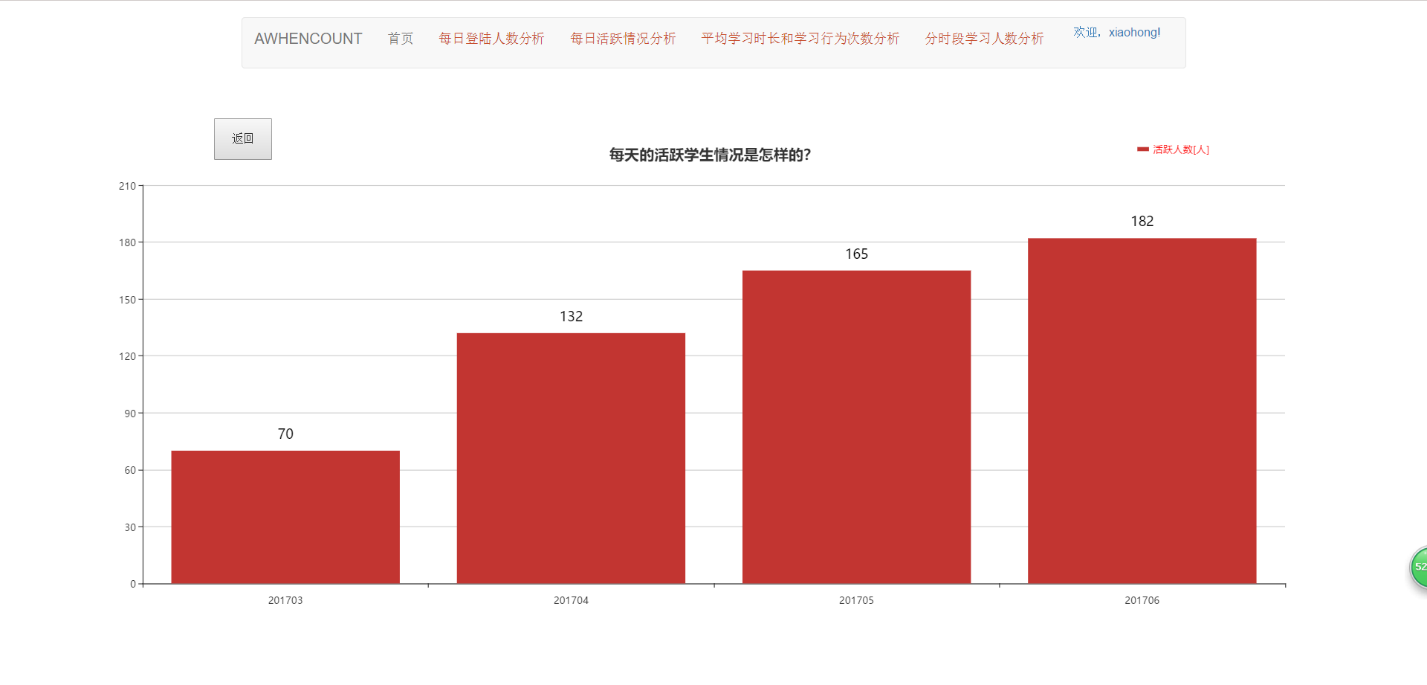
基于hadoop和echarts的教育大数据可视化系统,以B/S模式开发。通过Hadoop中Sqoop进行数据导入转换。以MapReduce构建数据分析,数据分析维度包括每日登录人数分析、平均学习时长分析、学习行为次数分析、每日活跃情况分析和分时段学习人数分析。最终使用ECharts可视化工具来对在线教育平台在学习过程中产生的数据进行可视化大屏展现,让更多人感受到可视化大数据的魅力。
关键词:教育大数据;可视化;ECharts;MapReduce
Educational big data visualization system based on hadoop and echarts
Abstract
The online education platform is an important part of the education system. In the context of the current era of big data, the educational institutions are encouraged to establish a unified platform and a unified digital management system for resource management. How to assess the health of the system platform, the learning experience of students and the quality of online courses are very important for the teachers of the course and the management of the school. This is the main purpose of data analysis. Visualization is an important way to help big data get complete data charts and mine the value of data. Big data analysis is inseparable from the tool of visualization.
Educational big data visualization system based on hadoop and echarts, developed in B/S mode. Data import and conversion through Sqoop in Hadoop. Data analysis is constructed by MapReduce. The data analysis dimensions include daily login number analysis, average learning duration analysis, learning behavior analysis, daily activity analysis and time-score learning analysis. Finally, the ECharts visualization tool is used to visualize the large-screen display of the data generated by the online education platform during the learning process, so that more people can feel the charm of visual big data.
Key words: Education big data; visualization; ECharts; MapReduce
目录